|
Micro Approach
The qualitative and quantitive modeling for the InfoStack is driven by a blue-ocean-like strategic decisioning process. For ICT and TMT service provider and vendors 8 price/market clearing supply and demand parameters, discussed here, are addressed by answering the following questions:
Questions a COO, CTO or business developer will ask (the “4Cs of supply”):
- What is the marginal cost? (acquisition, opex, interconnect, capex)
- Where is the coverage? (inbuilding, external, wide-area, seamlessness)
- How much capacity do you need? (network components, market segments)
- Why do people want clarity/QoS? (speed, performance, cost, convenience)
Questions a product developer, marketer or salesperson will ask (the “4Us of demand”):
- Why is it easy to use? (user-interface, learning, habits)
- When is it usable? (work, leisure, family, social)
- Which functions make it ubiquitous? (commerce, communications, consumption, creation)
- Who does it universally apply to? (demographics, gender, consumer, enterprise, government)
Scoring the above 8 issues serves to answer the below 3 questions for determining ROI:
Questions a Chief Strategist, CFO, analyst or investor will ask:
- How do you get the customer? (acquisition costs, capex)
- How do you keep the customer? (operating costs, maintenance capex)
- How do you stimulate demand? (R&D, reinvestment)
But all these issues are driven by what is going on in the sector around a given company, industry vertical or ecosystem. Incorporating them into a macro-framework is essential.
Macro Approach
IVP uses a three dimensional framework called The InfoStack™ to simplify the complex and rapidly changing ICT and TMT markets. InfoStack™ is a tool that organizes and prioritizes information for an industry or company or product, creating clarity and focus for business leaders to make intelligent, efficient decisions. It's value is to assign discrete coordinates to information (quantified and qualified) that can then be compared and related to other coordinates in a clear way. Known and unknown datasets can be incorporated. The result is focusing 50% on the issue(s) at hand, 30% on the areas immediately surrounding the immediate area of concern and 20% on broader, strategic issues.
The process begins with identifying the three most important drivers or causal elements for a particular product, company or industry. These drivers need to be quantifiable. For ICT and TMT two are very obvious: geography (including population and traffic density) and service (or network) layers. The 3rd driver is less obvious. Historically applications and markets were defined by separate networks and business models. In the future, application and market opportunities will be unlimited as every individual's demand curve can cross an infinite number of cloud solutions.
Once we can visualize this framework, every datapoint, product, company and industry can be understood with a high degree of accuracy when moving across 3 vectors. Modeling of future supply and demand is much more precise with the ability to capture the moving pieces beside, below and above any particular location in the framework (x,y,z). Factors influencing costs and competitive position at every boundary point between layers and verticals become clearer. Pricing can then be derived from marginal cost arrived at from iterative supply/demand scenarios.
The InfoStack™ is applicable at all sub sectors of the "converging" legacy networks: PSTN, data, mobility and content. It illustrates past, present and future consistently. It can be used by regulators, academics, trade management and capitalists alike. The "old" (circuit switched or analog) and "new" (packet-based and digital) InfoStacks are illustrated here:
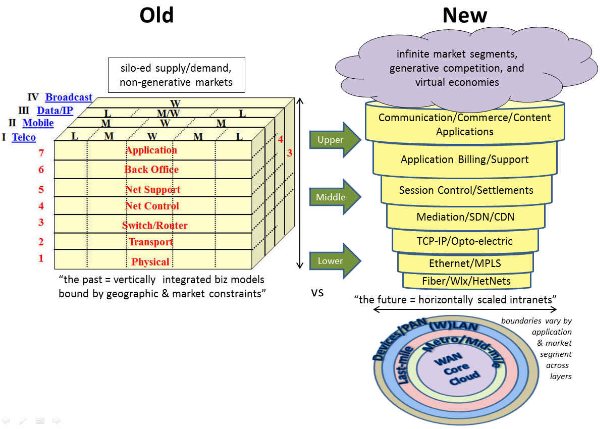
Compare the above illustrations with this one from Dialogic below and we see how modeling the 4 disparate service and business models above along 3 dimensions is more consistent than the typical flat 1 and 2-dimensional frameworks used by the "supply centric" industry.
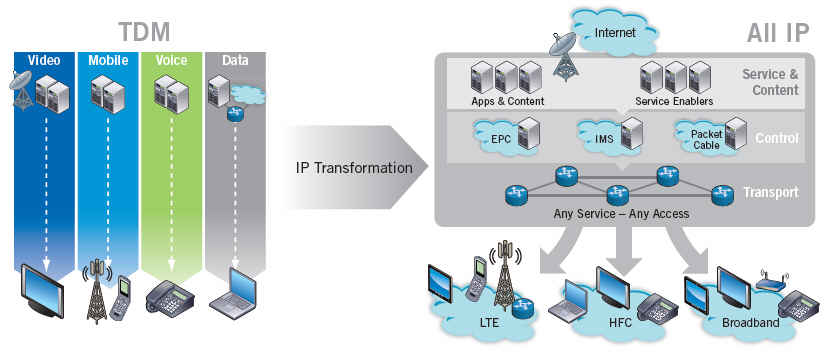
Source: Dialogic Inc.

The InfoStack can be applied universally, as evidenced by comparing the relationship between sports teams and company teams. The comparison is apt since we live in a knowledge economy where collaboration around collective information sets is just like moving a ball around a field. Specific product/market matrices are derived from the surrounding market matrix and then "egg-sliced" into the corporate layers like the illustration to the right. Specific balance sheet and P&L issues and questions like the ones raised above can be modeled and illustrated. Moreover the perspectives of individuals in the company can be captured, resource conflicts resolved, and better strategy and tactics developed.
|


